Workspace analytics
Account-level performance in the Analytics sidebar — targeted channels, window periods, trends plus per-channel metric cards.
Connect your agent today
Draft from chat, review in your calendar, and publish only what you approve.
Workspace analytics
How your connected channels performed over the last 7, 30, or 90 days.
Where: Choose Analytics in the account sidebar.
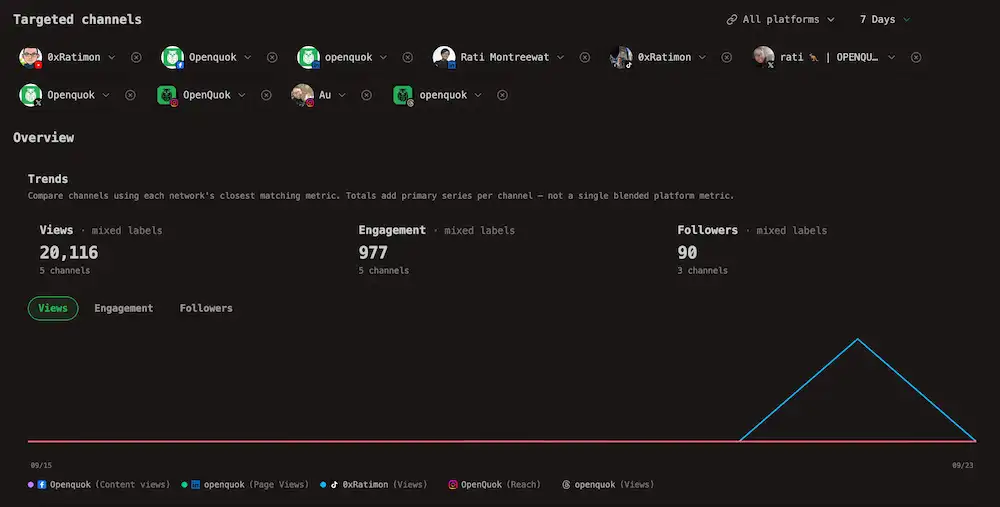
You see account-level numbers for channels that send stats back to OpenQuok. Each one appears as a chip under Targeted channels.
Warning
OpenQuok can only show what each network returns for your account. Names and fields differ by platform.
Which channels qualify, and which date ranges each one allows (7, 30, and 90) , are listed in Platforms → Analytics.
Targeted channels and date range
| Control | What it does |
|---|---|
| Targeted channels | Pick which connected channels to include. Use the platform filter to narrow the list. |
| Date range (e.g. 7 Days, 30 Days, sometimes 90 Days) | How far back the numbers go. The menu only shows ranges that work for every chip you selected. Changing the range reloads the page. |
Note
Instagram, Threads, and TikTok do not offer 90 days of account stats. If you include any of them, you only see 7 Days and 30 Days. 90 Days appears when every selected channel supports it — for example Facebook Page, YouTube, or X on their own. See Platforms → Analytics → Date range windows.
Overview
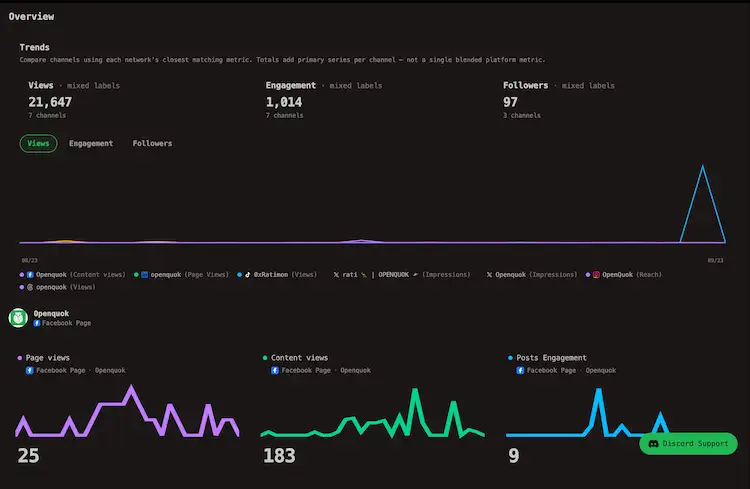
Under the filters, the Overview block matches the app: Trends on top, then metric cards for each channel.
Trends
Trends lines up channels side by side. Each network uses its own metric names, while OpenQuok groups the closest match under Views, Engagement, or Followers.
Warning
Each headline total adds one stat per channel.Because different networks use different metric names, the total is for a quick glance only. Platforms do not agree on the same official stat.
Note
For example, under Views, OpenQuok might add Instagram Reach, Facebook Content views, and TikTok Views. One headline, three different definitions.
| Piece | What it shows |
|---|---|
| Summary row | Three totals — Views, Engagement, Followers — and how many channels fed each total. You may see mixed labels when names differ across networks. |
| Tabs | Switch the chart between Views, Engagement, and Followers. |
| Line chart | One line per channel. The legend shows each network’s real label (for example Reach on Instagram). |
Tip
Use Trends to compare channels at a glance. Open the metric cards below when you need the exact name and total for one channel.
Channel metric cards
Below Trends, each card is one stat for one channel.
Warning
Cards stay separate per channel. Instagram Comments and LinkedIn Comments never merge into one card.
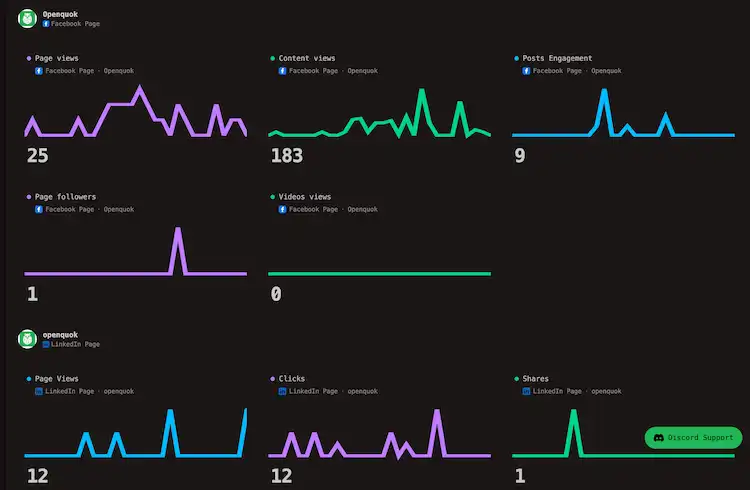
When you target several channels, cards sit under a channel header (picture and name). A small row under each title shows the platform and channel.
Each card shows a mini chart over time, the total for your date range, and how that total compares to the previous period of the same length.
While numbers load, you see Loading analytics…. If the request fails, the error appears in red.
Typical metrics by network
Titles on the cards come from the network. Platforms change these lists over time. The table is a guide, not a full catalog.
| Network | Typical account-level metrics |
|---|---|
| Facebook Page | Page impressions, post engagement, followers, media views |
| Instagram (Business or Standalone) | Followers, reach, likes, views, comments, shares, saves |
| LinkedIn Page | Page views, clicks, shares, engagement, comments, organic and paid followers |
| TikTok | Followers, video count, views, likes, comments, shares |
| YouTube | Watch time, average view duration, subscribers gained and lost, likes |
| Threads | Views, likes, replies, reposts, quotes |
| X | Impressions, likes, quotes, replies, reposts, bookmarks |
| Dev.to | Page views, reactions, comments |
When charts are empty
| Situation | What to try |
|---|---|
| No supported channels connected | Connect a channel from Platforms → Analytics, or use Go to the calendar to add channels on the empty screen. |
| Filter hides every channel | Clear the platform filter or connect a channel that matches. |
| This channel needs to be refreshed | Click Refresh channel and sign in again. Old tokens often break stats before posting stops. |
| No analytics available for the selected channels | The network returned nothing for this range. Try fewer days, wait if the channel is new, or check that your account type supports stats. |
| Self-hosted X | Your operator may have turned off X stats — see Social integrations → X. |
Platform analytics over the API
Programmatic channel-level access uses the same windows as the dashboard:
- Analytics APIs — integration endpoint with date 7, 30, or 90
- CLI — analytics:platform
- MCP — analyticsPlatform (see MCP tools)
Results are cached per organization, integration, and window on the backend to reduce provider rate limits.
Per-post metrics are documented in Per-post metrics.